
Microcontroller development moves fast. While the Arduino framework is great for rapid prototyping, production-grade hardware engineering often requires the raw optimization, power management features, and real-time operating system (FreeRTOS) integration native to Espressif’s official ESP-IDF (Espressif IoT Development Framework).
Managing toolchains directly inside ESP-IDF can be complex. This guide details how to build an isolated, reproducible development environment using PlatformIO to scaffold a project named learn-gsm-esp32-dev.
Choosing Your Scaffolding Workflow
PlatformIO offers two separate pathways to initialize a new runtime: an automated command-line tool or an integrated graphical user interface (GUI) inside Visual Studio Code. Both paths yield identical configuration structures.
Option A: The Rapid CLI Initialization
For developers working directly inside standard shells or automated scripting workflows, the PlatformIO Core CLI is the fastest tool available.
Execute this single string to build the folder structure, enter the directory, and invoke the scaffolding engine:
mkdir learn-gsm-esp32-dev && cd learn-gsm-esp32-dev && pio project init --board esp32dev --project-option "framework=espidf"
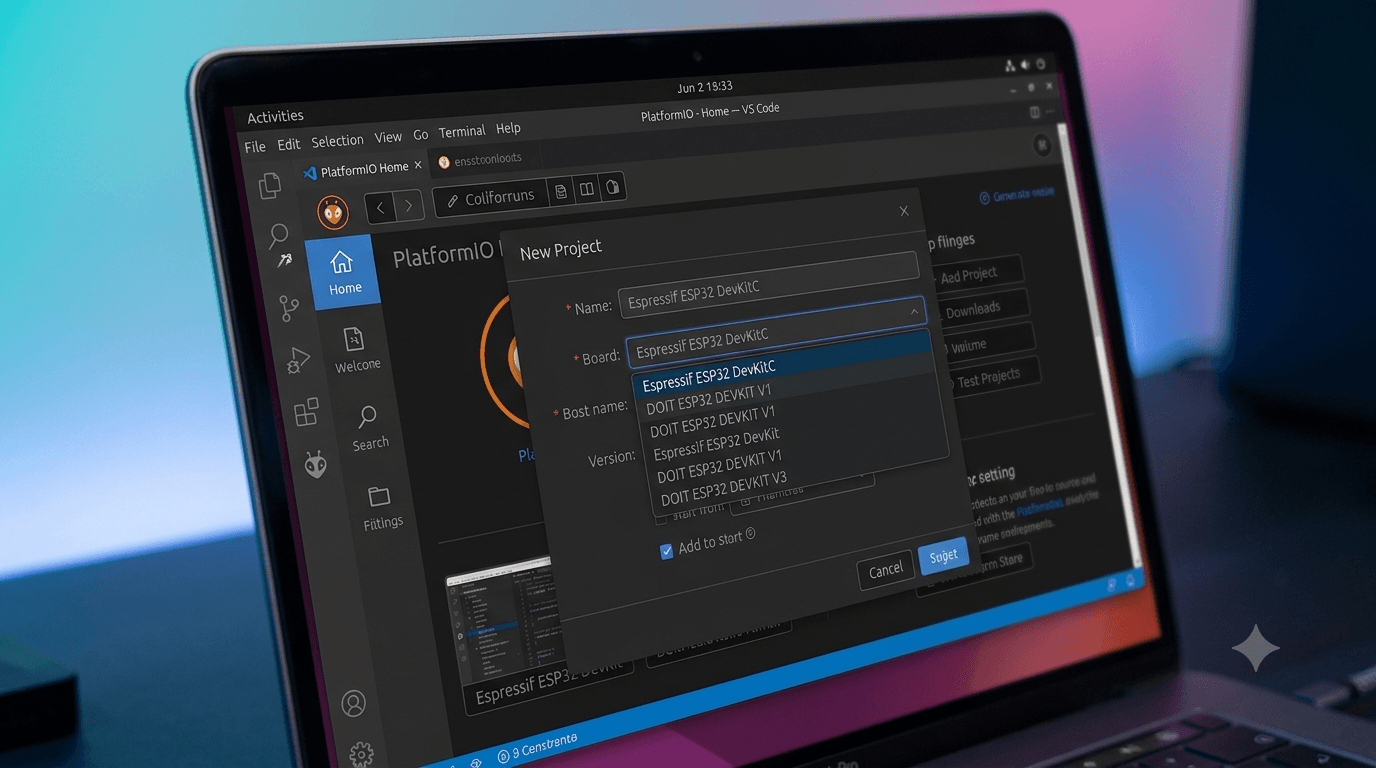
Option B: The VS Code Visual Wizard
If you prefer visual management tools within your IDE, follow these manual configuration steps:
- Open VS Code.
- Click the PlatformIO Alien Head icon on your primary sidebar activity deck.
- Locate the Quick Access panel and click PIO Home -> Open.
- Click the New Project button on the central control page.
- Provide your project metrics within the wizard form:
- Name:
learn-gsm-esp32-dev - Board: Select
Espressif ESP32 Dev Module - Framework: Select
Espressif IoT Development Framework
- Name:
- Click Finish to pull down necessary core compiler tools and create the space.
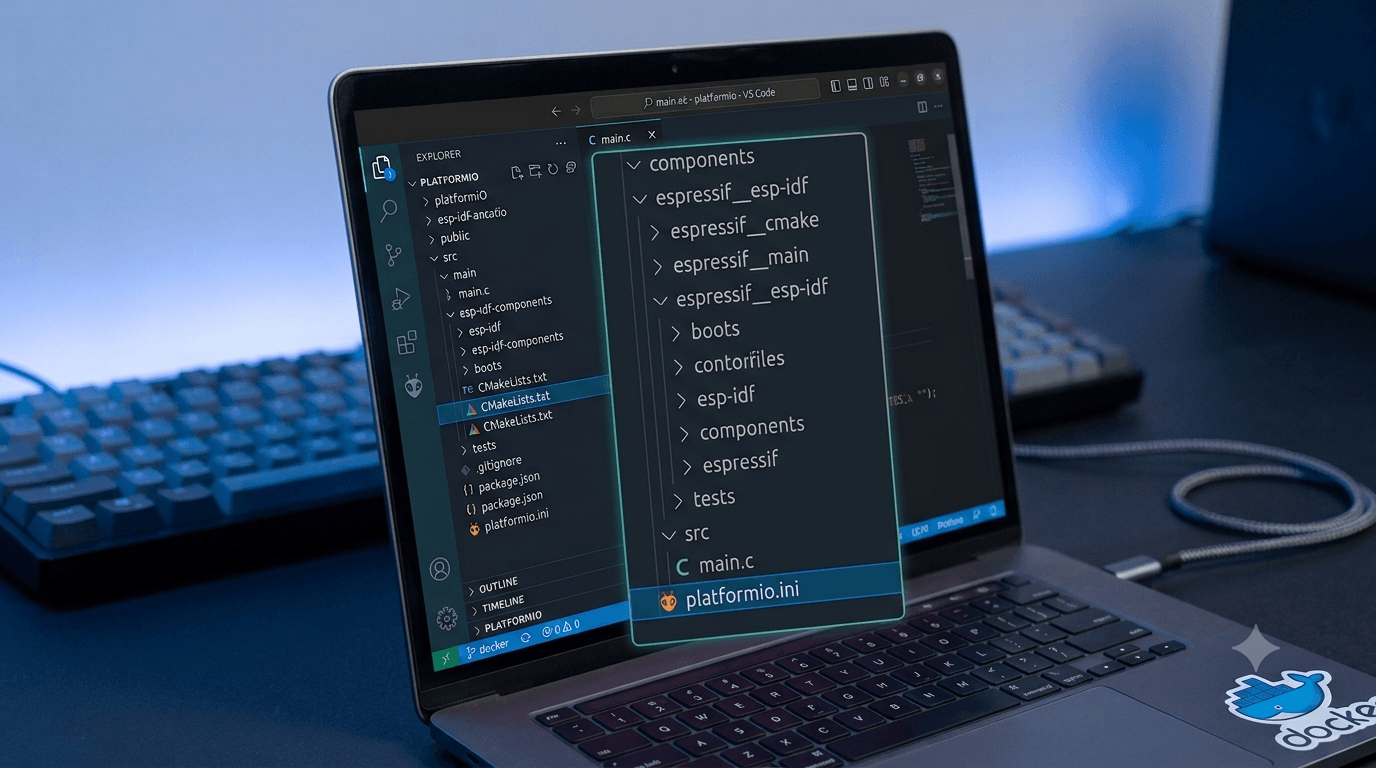
Navigating the Component File Structure
ESP-IDF relies heavily on a rigid configuration structure orchestrated by CMake compilation rules. Unlike traditional flat Arduino sketch structures, your initialized directory needs to mirror this system layout layout:
learn-gsm-esp32-dev/
├── include/
│   └── README
├── src/
│   ├── CMakeLists.txt
│   └── main.c
├── platformio.ini
└── CMakeLists.txt
Configuring the System Manifest Files
To make sure your project compiles perfectly on your hardware target, overwrite your file structures using the standard boilerplate snippets below.
1. The Global Environment Manifest (platformio.ini)
This root-level configuration defines how PlatformIO sets up its internal compilation pipelines, monitors outputs, and manages hardware flash targets.
[env:esp32dev]
platform = espressif32
board = esp32dev
framework = espidf
monitor_speed = 115200
2. Root Build Instructions (CMakeLists.txt)
This tells the base system build wrapper to locate your current ESP-IDF installation directory and load the required platform tools.
cmake_minimum_required(VERSION 3.16.0)
include(\$ENV{IDF_PATH}/tools/cmake/project.cmake)
project(learn-gsm-esp32-dev)
3. Component Build Targets (src/CMakeLists.txt)
ESP-IDF views project folders as a series of modular items. This file registers your local code blocks as active targets for inclusion during compiler execution passes.
idf_component_register(SRCS "main.c"
                    INCLUDE_DIRS ".")
4. Hardware Boilerplate Logic (src/main.c)
Unlike ordinary code loops, ESP-IDF relies directly on a non-returning execution target called app_main. This code implements simple periodic console logs using the native multitasking utility engine FreeRTOS.
#include <stdio.h>
#include "freertos/FreeRTOS.h"
#include "freertos/task.h"
#include "esp_log.h"

static const char *TAG = "MAIN";

void app_main(void)
{
    ESP_LOGI(TAG, "GSM ESP32 Project Initialized");

    while (1) {
        ESP_LOGI(TAG, "Hello World from GSM Dev Board!");
        vTaskDelay(pd_TO_TICKS(2000));
    }
}
Compiling and Running Code on Your Device
With the project successfully configured, you can use these shortcuts to build and upload your code:
- Compile the Binaries: Hit
Ctrl + Alt + B(Windows/Linux) orCmd + Option + B(macOS). - Flash & Open Logging Monitor: Press
Ctrl + Alt + Tto open your terminal menu shell, then select the Upload and Monitor task option.
Your terminal tool will begin tracking lines of standard serial log messages coming straight from your physical ESP32 device every two seconds.